

I couldn't find something that would show me a real life example of how my taxable income was broken out, so I built one! And thankfully it was super easy to build, and then deploy and share with all sorts of folks thanks to Netlify.
- Live app on Netlify
- Source code (it's public! Feel free to follow along, make suggestions, add issues, or fork and create your own versions!)
Inspiration
The other night, I was distraught that I could not find a calculator that would show how much of my taxable income would fall in each tax bracket. I could find a billion calculators to show my effective tax rate, which isn't what i was interested in.
(In case you don't know about marginal tax brackets—I think it's probably just an American concept— feel free to read up more on it here.)
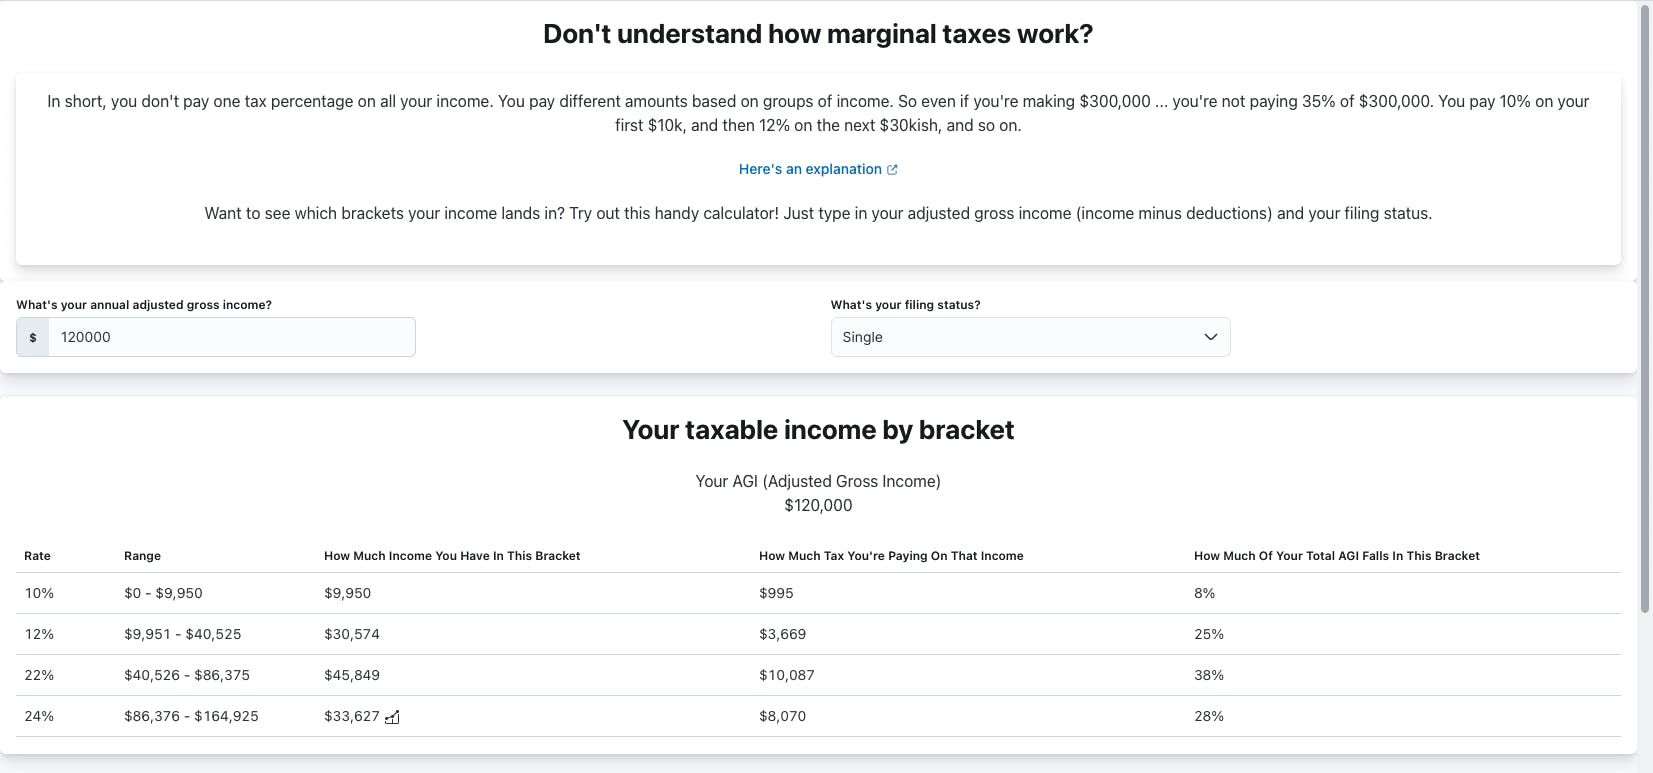
Here's the scenario: You have $120,000 taxable income. And you might assume you pay on average about 24% income tax! Unfortunately, this is how a lot of people think. But the truth is, you actually are only paying a 24% tax rate on that last $33,627 (so just over a quarter of your total taxable income).
I wanted to be able to explain this to people and help them see how much of their income their tax falls in various brackets. So I need to create a simple app where people could input their taxable income, select their filing status and then see how their money falls in those brackets.
So naturally I went to my whiteboard and started to pseudo-code the process.

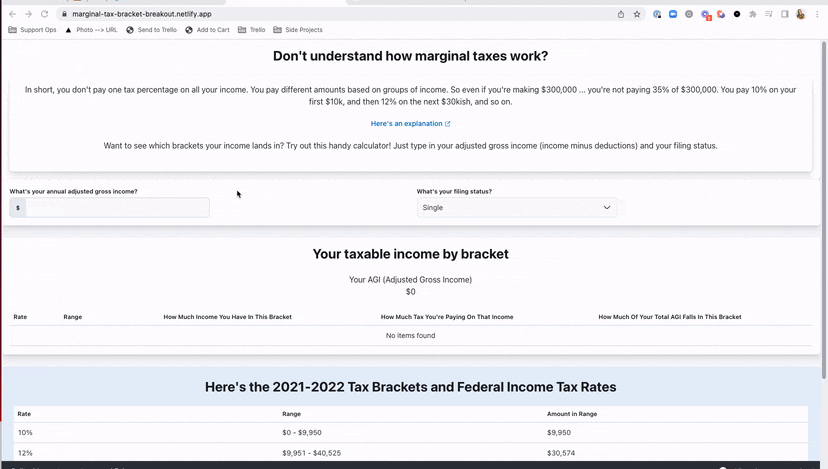
This is where I started.
Product Demo
And viola! This is where I ended!
 Sure enough I made it happen with some simple javascript, Eui design library, and of course, Netlify for hosting and deployment!
User Interface
I didn't want to spend too much time building custom components, so I utilized Elastic's open-source design library, Eui. It's a design library with prebuilt components that offer all the customization I need.
So it took all the work out of me building the components, while still allowing me to style them and organize them with my data and the settings that I want!
The specific components I used were:
- EuiBasicTable - used for returning the table data for the overall rates and the breakout for your income
- EuiPanel - used for creating groups for content and styling options for background
- EuiSpacer - used to create spacing between elements
- EuiTitle - title text styling
- EuiIcon renders an icon without having to import a custom import library
- EuiText - text styling
- EuiTooltip - shows a styled tooltip with content when hovering over an element you wrap this around
- EuiFieldText - text input for forms, used for setting income in this app
- EuiSelect - dropdown input for forms, used for setting filing status in this app
- EuiFlexGroup - flex grouping! no more having to remember how flex works and where, just wrap things in a flex group and...
- EuiFlexItem - defines flex elements so you can customize flex parameters without having to remember CSS and create custom classes for each item
- EuiForm and EuiFormRow form component and setting rows for fields
To use Eui, it's incredible easy (even a junior developer like me can get started quickly!).
- Run
yarn add @elastic/eui @elastic/datemath @emotion/react moment prop-typesat the root of your project. - Import the css in your
appfile :import '@elastic/eui/dist/eui_theme_light.css'; - Import the
EuiProviderelement at the top of yourappfile:import { EuiProvider } from '@elastic/eui'; - Then just wrap your main App function in `` ```
And viola! You can now import those components and follow the documentation to see how they're used! Or get ideas from my source code with this project.
The Code
Now that you see how I've designed incorporated the code for the visual elements, let's walk through some code for how I calculated the data.
Most of the work is happening in the src/components/Utilities.js file and the src/componenets/Breakdown.js file, as all the other components are either grabbing input or rendering data.
Let's start with Utiltiies
I created a utility for converting numbers to percentages, and another one for converting numbers to prettified currency formats. Thanks StackOverflow!
And then I hard coded all the Bracket Rates in an object that I could reference throughout the app. In a future version, I might find a way to get this from an API, but as a quick and dirty, simple approach I felt like this was fine (especially since they are consistent for at least a year).
My object was set up like this:
export const taxBrackets = [
  {
    name: "Single",
    id: "single-bracket",
    brackets: [
      {
        rate: 10,
        range: "$0 - $9,950",
        amountInRange: 9950,
      },...
So basically an array of objects that included a name, id, and then array of bracket objects.
The Maths
The hardest part of this whole app was building out the required logic to map through the brackets, and calculate based on a number input, how much income fell in each bracket, then calculating what % that was of your total taxable income, and how much total tax you paid on that income as a result of your amount in that bracket the tax rate.
I got some help from a coworker with thinking through all of this logic (#NeverFeelBadAskingForHelp) and together we built this reducer function that created an array of items to display in the table showing your income by each bracket.
 const yourBreakdown = props.filingStatus.brackets.reduce((acc, bracket) => {
// as long as you have income left, go through a bracket from TaxBrackets and do the maths
    if (remainingIncome > 0) {
       // if your remaining income is more than the current bracket range, take
       // the total bracket range amount, otherwise, use the remainder as that's
      // the only amount you'd have in that bracket
      const yourAmountInBracket =
        remainingIncome >= bracket.amountInRange
          ? bracket.amountInRange
          : remainingIncome;


     // calculate the remainder by looking at your total income
     // minus what you spent in that bracket

      const remainder =
        remainingIncome <= bracket.amountInRange &&
        bracket.amountInRange !== Infinity
          ? remainingIncome - bracket.amountInRange
          : undefined;

     // don't show the range if you are in the top tier, as its an unlimited range
      const amountInRange =
        bracket.amountInRange !== Infinity
          ? bracket.amountInRange
          : remainingIncome;

     // push these items to the array that the EuiBasicTable will use to render in a
     // beautiful table!
      acc.push({
        ...bracket, // get the bracket object from utilities so you can calc that data
        yourAmountInBracket, // defined above
        amountInRange, // defined above
        remainder, // defined above
        yourTaxOnThis: yourAmountInBracket * (bracket.rate / 100), // quick calc for $$ tax
        percentOfYourIncomeInThisBracket: percentage(
          (yourAmountInBracket / props.income) * 100
        ), // quick calc for % this bracket makes up of your whole taxable income
      });

      remainingIncome = Math.max(0, remainingIncome - bracket.amountInRange);
    } // if money left over in a bracket, show how much is left in that range for tooltip

    return acc;
  }, []);
See the comments inline for explanations about each one. (If they don't make sense, comment in here and I'll happily jump in and try to explain better!)
And that's the core of this app!
How To Deploy
When I first became a developer, the hardest part of developing was showing friends and family what I created. I could build it on localhost, but my local host was, well, local! 😂
I discovered Netlify through a bootcamp a couple years ago, and it's changed my life - especially for apps like these. Previously I'd have had to build the files locally, then find somewhere to host them, and deploy them. Then whenever I made changes, I'd have to repeat the whole process.
With Netlify, all I have to do is connect to my repo, set my build command, and boom! It's live with a URL that i can customize and send to family and friends. And anytime I make code changes that are pushed to main, Netlify triggers another build and deploy!
See? Literally just a few clicks!
Future Ideas
I feel like this is just the start - I've had a lot of people give more ideas, like incorporating a way to calculate deductions so you can find your adjusted gross income based on annual income vs deductions.
I'd also like to add a chart in here to better visualize how your money fits in brackets.
Maybe I'll get to these at some point, but also, it's open source, so if you're feel inspired, feel free to take a crack at it! You can clone this repo, and when you're ready to show the world, just create a Netlify account, and deploy via Github just like I did in the example above! I'd love to see what you come up with, so feel free to drop a comment with your link.